cycle4.trade

Multi-timeframe market intelligence for crypto and major markets

See what changed. See what is true now. Understand how timeframes agree — or conflict.

Cycle4 reads where 17 crypto and macro markets sit in their own rhythm, across seven timeframes at once — then lets you ask it on Telegram. It describes what the market is doing. It does not predict what it will do next. Free to start today.

Free to start · no card · leave anytime · mechanical signals, not advice.

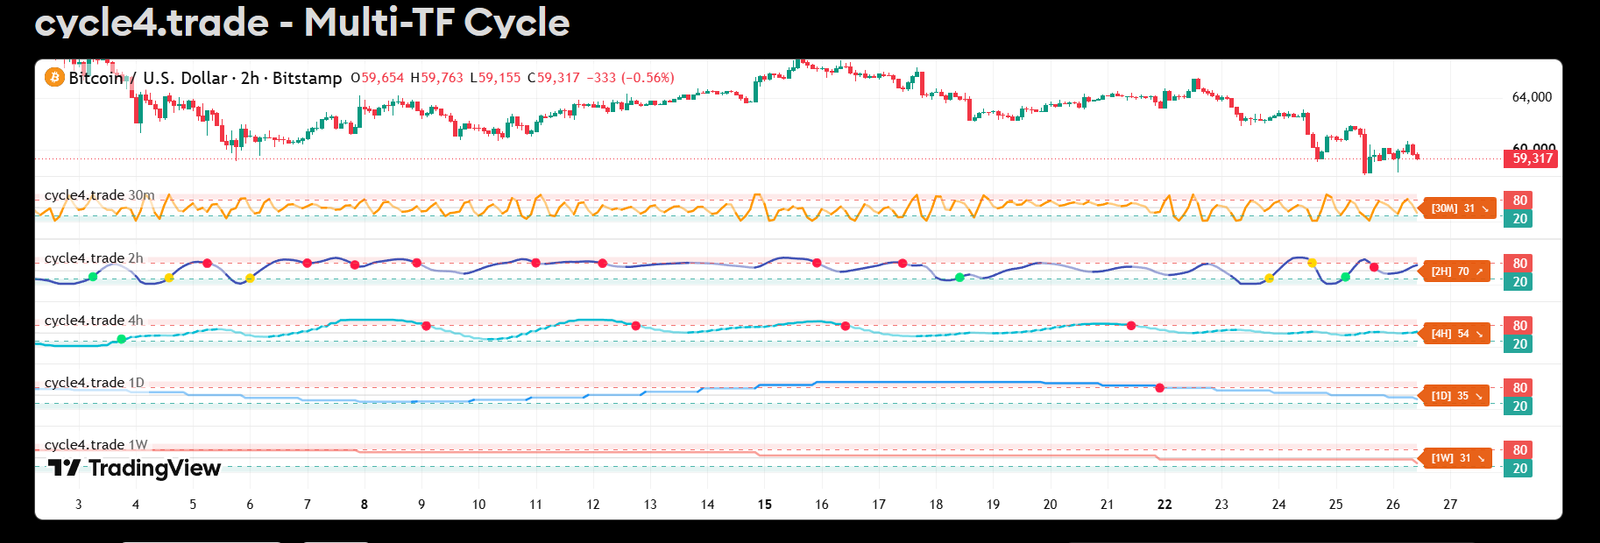
cycle4.trade Multi-TF Cycle indicator on TradingView: Bitcoin with 30m, 2H, 4H, 1D and 1W cycle oscillator panels, 80/20 overbought and oversold bands, and cycle-low/high dots
The cycle system

See where every market sits in its cycle

Markets move in repeating up-and-down rhythms. The cycle engine turns each market's price into a single 0–100 oscillator that shows where it sits in that rhythm — low (stretched down, a turn up more likely) or high (stretched up, a turn down more likely).

The same read is computed across seven timeframes (30m → 2-week), forming a multi-timeframe map. When the slow and fast frames agree, that is a different market condition from when they conflict — and the conflict is often the more useful read. It is a description of rhythm, not a recommendation, and not a forecast.

Start free on Telegram Free · no card · leave anytime.

Reading the map

What a real chart looks like

A textbook cycle is a clean, even wave. A live chart isn't — real cycles stretch and compress, and higher timeframes move so slowly that, zoomed out, they can look almost flat. Any simplified picture (our logo included) just shows the idea: every timeframe moves in cycles. Live, those cycles overlap into something more complex.

That complexity is exactly what cycle4.trade is for. It normalizes every timeframe to the same 0–100 scale and stacks them — turning a structure that's hard to eyeball into a map you can scan, with the signals marking where timeframes line up. With a little practice the map becomes intuitive; either way it stays a mechanical read of where each cycle sits — never financial advice.

On your chart

The TradingView indicator

Add the cycle oscillator to any chart and see the rhythm directly — overbought/oversold zones, the turn signals, and how the different timeframes line up around the current move.

How to open it

  1. Open any symbol on TradingView.
  2. Add the cycle4.trade indicator from the invite link.
  3. Read the 0–100 oscillator: low = stretched down, high = stretched up.
  4. Stack the multi-timeframe view to see which timeframes agree.

Why use it

It turns a noisy chart into one clear rhythm read, and shows multi-timeframe agreement at a glance — so you can see context (where price sits in its cycle, and whether the bigger timeframes line up) instead of guessing. Information to inform your own judgement, never a trade instruction.

Open on TradingView

In your pocket

The Telegram signals

The bot watches the same cycle read across markets and timeframes and posts when a market reaches a stretched turning point — with the multi-timeframe context attached. Signals are mechanical and non-advisory: they describe what the cycle is doing, not what you should do.

The research behind them

The signals aren't guesswork. Behind the bot is a backtesting engine that has studied this cycle read across ~8.8 years of history and many crypto markets. A few honest takeaways it produced:

Context, not a forecast

We test our reads against simple alternatives — like just holding, or just holding less. What survives, we keep; what does not, we retire and say so. Everything Cycle4 publishes today is labelled Evidence: Context: a description of current market structure, not a validated price forecast.

Exits over entries

Testing showed the exit mattered more than the entry: a trailing approach kept gains that holding-to-the-end gave back. The bot frames context, not directions.

Start free on Telegram Free · no card · leave anytime.

Also on Discord

Your coins, your channels — on Discord

Prefer a community and a cleaner feed? The same cycle bells run on our Discord, split into one channel per coin#btc #eth #sol #bnb #other-coins — so you follow only the markets you care about instead of one mixed stream. Each coin channel also carries a growing library of education about that asset.

It's a place to read the cycles together — same honest, non-advisory signals, free to join. Telegram stays the full experience; Discord is the community-and-segmented-feed way in.

Join on Discord Free · one channel per coin · same signals.

A quick read

Ask it anything, any time

Cycle4 is not only an alert stream — you can ask it. Four commands on Telegram, each answering a different question:

/market — what is true now

All 17 tracked markets, one line each.

₿ CRYPTO
BTC   ↑ Bullish · MTF 7/7 · phase 20/100
ETH   ↔ Mixed   · MTF 5/7 · phase 24/100
SOL   ↓ Bearish · MTF 7/7 · phase 76/100

🌍 MARKETS
GLD   ↔ Mixed   · MTF 5/7 · phase 72/100

/state BTC — one asset, in depth

BTC · 4H low zone
Updated 16:18 UTC
4H direction up for 2h

30m↑ | 2H⇑ | 4H⇑ | 1D⇑ | 3D↑ | 1W↑ | 2W⇡
MTF: 7/7 aligned · all up
Cycle: phase 18/100 · period ~28.3d
Trend: bullish

Evidence: Context · /explain

/today — what changed since yesterday

TREND CHANGES
ETH: bullish → mixed

HIGHER-TF CHANGES
BTC 1D: up → down

CRYPTO BREADTH
Bullish 13 → 11 · Mixed 0 → 1

/explain — what the words mean

Cycle phase, the seven-timeframe grid, why timeframes conflict, why an oversold reading is not a buy, and what Evidence: Context means. Written plainly, and honest about what each thing does not tell you.

Four questions, four answers

How to read a signal

Every alert has the same anatomy — it describes what the cycle is doing, with the multi-timeframe context attached:

Anatomy of an alert

  1. Heading — 🟢 CYCLE LOW (stretched down, turning up) or 🔴 CYCLE HIGH (stretched up, turning down).
  2. Horizon & conviction — e.g. SWING · HIGH: the trade horizon (SCALP / SWING / POSITION) and how strongly the 1-day cycle backs it (HIGH / MID / LOW).
  3. X / 7 TFs — how many of the seven timeframes support the move.
  4. Arrow grid — each timeframe's cycle direction & strength at a glance.
  5. Phase & cycle — the 0–100 reading and the rough cycle length.
  6. Quality medal — 🥇/🥈/🥉, the asset's recent track record on that timeframe (information only).

The signal types

Turn signals — a cycle turn with full context:

  • 🟢 CYCLE LOW — stretched-down turn
  • 🔴 CYCLE HIGH — stretched-up turn

Watch bells (🔔) — earlier "keep an eye on this" observations, not confirmed turns:

  • 🟡🔔 / 🟠🔔 — entering an oversold / overbought zone
  • 🟢🔔 / 🔴🔔 — deep in an oversold / overbought zone

Everything above is context for your own judgement — a description of the rhythm, never an instruction to act.

Now watch them fire live → Start free on Telegram

Better with friends

Read the cycles together — and grow your access

The edge is more useful with the people you already talk markets with. Join free, then invite friends who'd trade cycles using your personal link from inside the bot — every friend who joins extends your own access by 4 days (up to +16). You read the rhythm together, and your own run grows as they join.

Today beats tomorrow — the edge runs whether you're using it or not, and the earliest members have the most friends still to invite.

Start free & invite friends Free · no card · leave anytime.

Straight talk

Honest by design

cycle4.trade shares mechanical, educational information — not financial advice, not a recommendation, and not a promise of returns. Everything we publish today is labelled Evidence: Context — it describes current market structure, it does not forecast price. We test our ideas against simple alternatives and retire the ones that do not hold up. You are responsible for your own decisions and your own risk.

Questions

Straight answers

Is this financial advice?

No. cycle4.trade shares mechanical, educational information about where each market sits in its cycle — a description of the rhythm, never a recommendation or an instruction to act. Every signal is non-advisory by design, and every decision is yours.

Do you ever hold, touch, or manage my money?

No. cycle4.trade is information only — a TradingView indicator and a signal bot. You don't deposit anything, connect an exchange, or hand over funds. There's nothing to send us, and we never take custody of your money.

What do I actually get for free?

The TradingView cycle indicator, the Telegram signal bot, and the per-coin Discord channels — the full read of where every market sits across seven timeframes. Free to start, no card, leave anytime.

Do you promise profits or guaranteed returns?

No — and be wary of anyone who does. We do not claim a validated trading edge, and we do not predict price. We show you where a market sits in its rhythm, on seven timeframes at once, and whether those timeframes agree. The decisions, and the risk, are yours.

Is the edge real, or just marketing?

Real, and tested. Behind the bot is a backtesting engine that studied this cycle read across ~8.8 years of history and many crypto markets — the most reliable pattern, a 1-day + 4-hour cycle agreement, beats a coin flip over years of testing, including bear markets. We keep the claims honest and qualitative: a genuine edge you apply with discipline, not a magic number.

Can I leave anytime?

Yes. Free to start, no card, and you can walk away owing nothing — mute a channel or stop the bot whenever you like. If you're getting value, inviting a friend even extends your own free access.

Start free on Telegram Free · no card · leave anytime.
Start reading the rhythm — free, today

Clear market context, shown honestly. Today beats tomorrow.

Start free on Telegram Get the free indicator Join on Discord

Free · no card · leave anytime · mechanical signals, not advice.